Description:
[Summary]
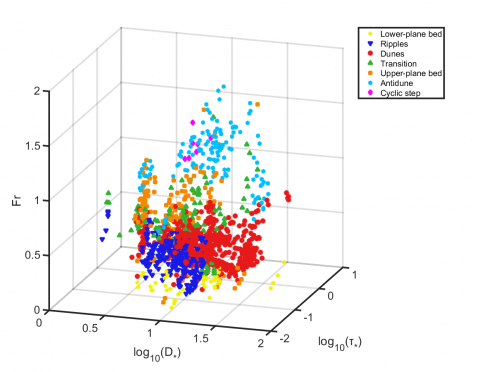
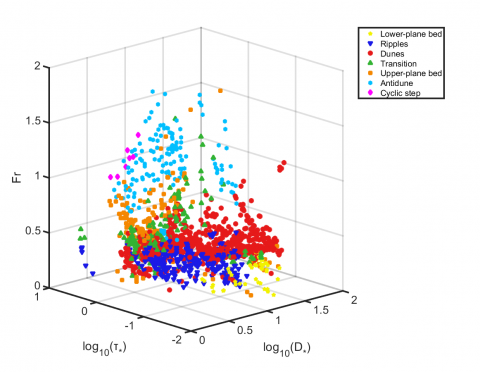
This study provides boundary lines of bedform stability regions defined as discriminant functions of dimensionless parameters. The following is the method for caluculating the functions. First of all, we defined a new bedform existence diagram using three parameters in dimensionless form. This study produces a new stability diagram, which defines bedform stability regions by three dimensionless parameters. On the basis of the diagram described above, discriminant functions are derived. The discriminant functions of bedforms obtained in this study can serve quantitative paleo-flow analysis of sedimentary structures. Their form is Fr = ƒ(D*, τ*). This function can be recast in the form U = ƒ(D, h), where U = flow velocity; D = sediment particle size; h = flow depth. Thus, when we obtain the data of sediment particle size and flow depth from sedimentary structures, we can estimate paleo-flow velocity. The discriminant functions are useful and objective for estimation of paleo-flow conditions.
[Methods]
Stability diagram: This study produces a new bedform stability diagram on the basis of over 1000 laboratory and field data conducted by previous studies. This new diagram defines bedform stability regions by three dimensionless parameters; dimensionless grain size D*, Shields mobility parameter τ* and Froude number Fr.
Discriminant functions: Discriminant functions are derived by following procedures. The following is the only a part of the whole program written in MATLAB. At first, a polynomial function with arbitrary coefficients which divides parametric space is supposed as a candidate of a bedform discriminant function.
Z = r(1) .* x .* x + r(2) .* y .* y + r(3) .* x .* y + r(4) .* x + r(5) .* y + r(6)
where, r = arbitrary coefficients; x, y = log10D*, log10τ* caluculated from data of previous studies; Z = a candidate of discriminant function. This function corresponds to a paraboloid in a parametric space. Then, the ratio of data points of bedform experiments that was judged incorrectly by the polynomial function is calculated.
function mis_class = candidate(r)
mis_class = sum(z(p==bed2)<Z(p==bed2)) + sum(z(p==bed1)>Z(p==bed1))
end
where, z = Fr caluculated from previous studies; p = bedform type; bed1,bed2 = bedform type whose stability regions are divided. Namely, the misclassification rate is calculated for evaluation of the function. At last, in order to minimize the misclassification rate, coefficients of polynomial function is optimized by using the Nelder-Mead simplex algorithm.
[coefficients, mis_class_rate] = fminsearch(@candidate,r(i,:))
[Data Sources]
Brownlie, W. R. and Brooks, N. H., 1981, Compilation of alluvial channel data: laboratory and field. California Institute of Technology, WM Keck Laboratory of Hydraulics and Water Resources.
Julien, P. Y., and Raslan, Y.,1998, Upper-regime plane bed. Journal of Hydraulic Engineering, 124(11), 1086–1096.
Image:


Keywords: